What ROAS do you actually need?
Enter your numbers below — everything updates instantly, nothing is sent anywhere unless you ask for your results by email.
There’s a number that decides whether your advertising is a growth engine or a slow leak — and most people running ads have never calculated it. Business owners feel it as the gap between “my dashboard says profit” and “my bank balance says otherwise.” Marketers who master it get hired and trusted, because they can look at any account, in any industry, and say with confidence: this makes money, this doesn’t. That number is your break-even ROAS. This guide explains it from scratch, then shows you exactly how it works across ecommerce, SaaS, clinics, real estate, coaching, and B2B — with the math in both rupees and dollars.
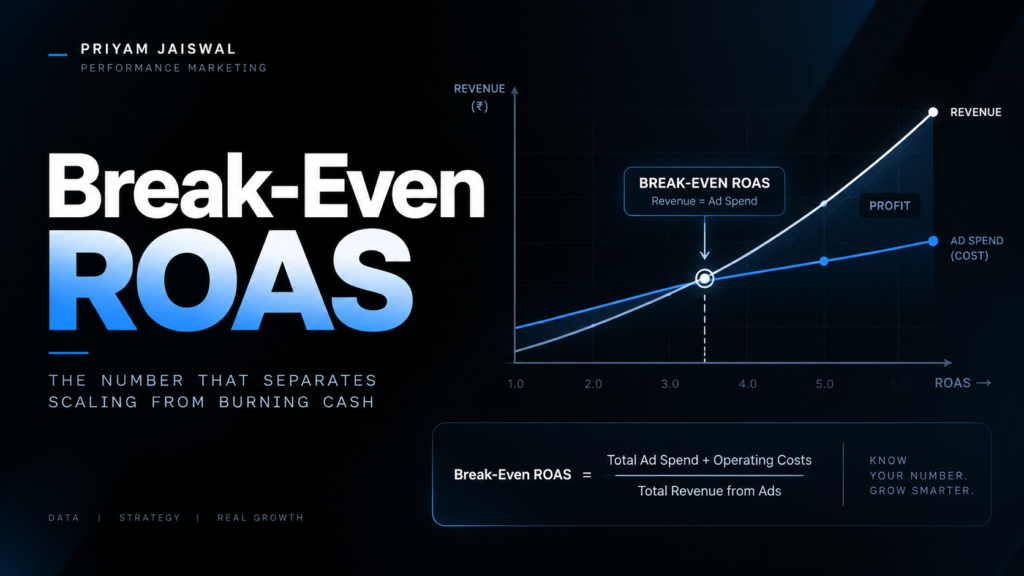
Quick answer: Break-even ROAS is the return on ad spend at which an order makes exactly zero profit. It equals
1 ÷ your contribution margin. If your margin is 50%, you break even at 2.0x — you must earn ₹2 (or $2) for every ₹1 spent on ads just to reach zero. Every ROAS below that number loses money, no matter how “positive” it looks on the dashboard.
First, what is ROAS — and why break-even is the number that matters
ROAS (Return On Ad Spend) is simply revenue divided by ad spend. Spend ₹1,00,000, make ₹3,00,000, that’s a 3.0x ROAS. Easy. It’s also where most people stop thinking — and that’s the trap.
ROAS measures revenue, not profit. But the product you sold cost money to make, ship, and support. So the real question isn’t “did I get more revenue than I spent on ads?” — it’s “did I get more revenue than the ad spend plus the cost of the thing I sold?” The exact tipping point where the answer flips from no to yes is your break-even ROAS.
Marketer’s note: When someone says “we run at 2x ROAS,” your first question should always be “and what’s your break-even?” A 2x on a 40% margin is losing money; a 2x on a 70% margin is printing it. The ratio means nothing without the margin behind it.
Why a “positive” ROAS can still be a loss
Here’s the myth that costs businesses the most money: the belief that break-even is 1.0x — “if I get my ad spend back in revenue, I’m even.”
You’re not. At 1.0x you got your ad spend back, but you still paid to manufacture, ship, and process the order. Those costs come straight out of the revenue. So your true break-even sits well above 1.0x — usually somewhere between 1.1x and 4x depending on your margins. Run below it and you lose money on every single sale, faster the more you scale.
Insight: A green ROAS number only means you beat 1.0x. It says nothing about whether you beat your break-even. Scaling a campaign that’s positive-but-below-break-even doesn’t grow the business — it accelerates the loss.
The universal formula (works in every industry)
Break-Even ROAS = 1 ÷ Contribution Margin

Contribution Margin (%) = (Revenue − Variable Costs excl. ad spend) ÷ Revenue
Variable costs are everything that scales with each sale except the ad spend — cost of goods, shipping, payment fees, returns, per-order support. Never include ad spend; that’s the thing you’re solving for. Fixed costs like rent and salaries don’t belong here either — this is about the margin on the next sale.
Want to bake in a profit, not just break even? Use the target version:
Target ROAS = 1 ÷ (Contribution Margin − Desired Net Margin %)That’s the whole toolkit. Two formulas, every industry.
How to calculate it in four steps
- Find your revenue per sale (average order value, deal size, plan price, service ticket).
- List every variable cost that comes with that sale — leave out ad spend and fixed overhead.
- Contribution margin = (revenue − variable costs) ÷ revenue.
- Break-even ROAS = 1 ÷ that margin.
Example: A ₹2,000 order with ₹900 of variable costs has ₹1,100 of contribution → a 55% margin → a break-even ROAS of 1.82x. Below 1.82x you lose money; above it you profit.
Break-even ROAS across six industries
The formula never changes — but what counts as revenue and the trap to watch for changes a lot by business model. This is the part that separates people who “know ROAS” from people who understand it.
| Industry | What “revenue” really is | Example margin | Break-even ROAS | The twist to watch |
|---|---|---|---|---|
| Ecommerce / D2C | The order (AOV) | 55% | 1.82x | Returns/RTO quietly raise it 0.2–0.4x |
| SaaS | Lifetime value, not one month | 85% | 1.18x on month one — but judge on LTV | First-month ROAS makes healthy ads look like losses |
| Clinics / local service | Service ticket + patient LTV | 57% | 1.75x | Judge the whole funnel, not cost per lead |
| Real estate | Net commission per closed deal | — | ~1.25x on commission | Everything hinges on your true close rate |
| Coaching / info products | Course price + back-end upsells | 90% | 1.11x | Refunds and chargebacks erode the margin |
| B2B / agency retainers | Retainer × client lifespan | 60% | 1.67x month one — judge on LTV | Long sales cycle; measure allowable CAC, not first invoice |
A few notes so each makes sense:
- Ecommerce / D2C is the textbook case: physical margin, one-time revenue, break-even = 1 ÷ margin. The killer is forgetting returns.
- SaaS revenue recurs monthly, so a first-month “break-even ROAS” of 1.18x is misleading — a customer who costs more than one month’s margin to acquire can still be hugely profitable over an 18-month life. Pros measure allowable CAC vs LTV and CAC payback, not first-payment ROAS.
- Clinics and local service businesses buy leads, not sales. Your true cost per patient is
cost per lead ÷ (booking rate × show rate × close rate). A ₹800 lead can produce a ₹13,000 patient that’s still wildly profitable against a ₹20,000 allowable spend — owners who panic at the lead price kill winners. - Real estate has huge, rare payoffs, so the useful metric is allowable cost per lead = net commission ÷ leads-per-deal. The entire number swings on your close-rate assumption — guess 1-in-100 when it’s really 1-in-150 and you’ll overspend by 50%.
- Coaching / info products have gorgeous margins (90%+), so break-even looks tiny — until refunds, chargebacks, and payment fees eat in. Many run the front-end offer near break-even and make their profit on the back-end upsell.
- B2B / agencies sell retainers, so like SaaS the honest lens is lifetime value across the client’s tenure, not the first month’s invoice.
Marketer’s note: Notice the pattern. One-time-revenue businesses (D2C, coaching) use
1 ÷ margindirectly. Recurring-revenue businesses (SaaS, agencies) use LTV-based allowable CAC. Lead-driven businesses (clinics, real estate) run the margin math through the funnel first. Learn those three shapes and you can price ads for any business on earth.
How the wrong number costs millions
This isn’t abstract. Take a D2C brand spending ₹40,00,000/month that believes break-even is “around 1.3x” and happily scales at a 1.6x ROAS — when their true break-even is 1.82x.
- Revenue at 1.6x = ₹64,00,000
- Contribution (55%) = ₹35,20,000
- Minus ad spend ₹40,00,000 = −₹4,80,000 every month → −₹57.6 lakh a year.
The same store in dollars, spending $120,000/month, quietly loses ~$173,000 a year. Nothing on the dashboard looked wrong. The only thing that would have caught it is knowing the real break-even number — and either fixing the funnel to clear 1.82x or refusing to scale.
Now multiply that logic across industries: the clinic that switches off a 2.6x campaign because leads “feel expensive” forfeits ₹48 lakh+ a year once patient lifetime value is counted. The real-estate team that mis-estimates close rate by half a percent turns a launch into a ₹40–72 lakh loss. Same root cause every time — a decision made against the wrong break-even.
Insight: The biggest marketing losses rarely come from a bad campaign. They come from a good campaign judged against a wrong break-even number — scaled when it should’ve been cut, or cut when it should’ve been scaled.
The vocabulary that makes you sound like a pro
If you’re learning performance marketing, these are the terms that turn “I think it’s working” into “here’s the number”:
- Contribution margin — revenue minus variable costs, as a %. The engine of the whole calculation.
- Break-even ROAS — 1 ÷ contribution margin. Zero-profit point.
- Target ROAS — the ROAS that hits your desired profit, not just zero.
- Allowable CAC — the most you can pay to acquire a customer before lifetime profit hits zero (the LTV world’s version of break-even).
- CAC payback — how many months of margin it takes to repay acquisition cost. Under ~12 months is healthy.
- LTV:CAC — lifetime value to acquisition cost. Aim for 3:1 or better.
- MER (Marketing Efficiency Ratio) — total revenue ÷ total marketing spend. The blended, honest, whole-business view that platform ROAS can’t fake.
- POAS (Profit On Ad Spend) — ROAS’s smarter sibling: profit, not revenue, over ad spend. Where sophisticated brands are heading.
Marketer’s note: When you can move fluently between ROAS, MER, and POAS — and explain why a SaaS account should ignore first-month ROAS — you’re no longer a button-pusher. You’re the person the business trusts with its budget.
Six ways to lower your break-even ROAS
Your break-even falls as your contribution margin rises. That means more of your ads become profitable without spending a rupee more:
- Raise average order/deal value — bundles, tiers, upsells spread fixed-ish costs over more revenue.
- Cut returns, refunds, and no-shows — each one is a direct hit to effective margin.
- Negotiate COGS, shipping, and payment fees at volume.
- Sell again — email, WhatsApp, and recall systems let you break even over lifetime value, not a single transaction.
- Discount less — every coupon lowers margin and raises the ROAS you need to survive.
- Improve funnel conversion (lead → sale) — for service and lead-gen businesses, this drops cost per acquired customer faster than any bid change.
Common break-even ROAS mistakes
- Treating 1.0x as break-even — the single most expensive error in advertising.
- Judging SaaS or agencies on first-month ROAS — ignores the 12–24 months of margin that follow.
- Killing a campaign on cost per lead alone — leads aren’t customers; run the funnel first.
- Assuming your close rate instead of measuring it — especially lethal in real estate.
- Forgetting returns, refunds, and chargebacks — they quietly move your real break-even.
- Confusing platform ROAS with business profit — trust MER and POAS over any one dashboard’s self-reported number.
Frequently asked questions
What is a good break-even ROAS? There’s no universal number — it’s set entirely by your margin. High-margin businesses (software, coaching, cosmetics) break even near 1.1–1.8x; lower-margin ones (electronics, apparel with returns) can need 2.5–4x. The goal is always to beat your own break-even, not an industry average.
Is break-even ROAS the same as target ROAS? No. Break-even ROAS is zero profit. Target ROAS builds in the profit you want: Target ROAS = 1 ÷ (contribution margin − desired net margin).
Should I include ad spend when I calculate it? Never. Ad spend is the variable you’re solving for. Including it double-counts and hides your true break-even.
Does break-even ROAS work for SaaS and service businesses too? Yes, with a lens. Recurring-revenue businesses measure it as allowable CAC against lifetime value; lead-driven businesses run the margin math through their funnel. The core formula (1 ÷ contribution margin) is always the starting point.
Why is my “profitable” ROAS still losing money? Because your break-even is higher than your actual ROAS. A positive dashboard number just means you beat 1.0x — not that you beat your margin-based break-even.
Key takeaways
- Break-even ROAS = 1 ÷ contribution margin. It’s the zero-profit line, and it’s almost never 1.0x.
- A “positive” ROAS below your break-even loses money on every sale — and scaling it accelerates the loss.
- The formula is universal; only what counts as revenue changes by industry (one-time margin, LTV, or funnel-adjusted).
- Getting the number wrong at scale costs real businesses ₹40–70 lakh / $170k+ a year.
- Owners: know your break-even before you scale. Learners: master ROAS, MER, POAS, and allowable CAC, and you’ll be able to price ads for any business.
Run your own margin through the calculator above and find your real break-even — then compare it to your last 30 days of ROAS. If you’re an owner, that gap is either your profit or your leak. If you’re learning, that gap is the exact skill that gets marketers hired. I audit live ad accounts across every one of these industries and rebuild the unit economics so every rupee of spend clears its break-even — no stock dashboards, real numbers only.