Quick answer: To read a Meta sales campaign, check your metrics in funnel order. Start with CPM and frequency (is anyone seeing the ad?), then hook rate and hold rate (did they stop scrolling?), then link CTR and CPC (did they click?), then landing page views, add-to-carts and conversion rate (did they buy?), and finally ROAS compared against your breakeven ROAS (did you make money?). The first stage that looks bad is where your problem lives. Low CTR usually points to the creative. Good CTR with poor conversions usually points to the landing page or offer. A “good” ROAS that sits below breakeven is a margin problem, not an ads problem.
Open Ads Manager for the first time and you’re greeted by what looks like a spreadsheet designed by someone who personally dislikes you. Hundreds of columns. Numbers that turn red for reasons nobody explains. A tiny arrow that may or may not mean anything. 😵
Here’s what nobody tells beginners: you need roughly 15 of those metrics to run a profitable Meta sales campaign. The rest mostly exist to make weekly reports look longer.
I’ve managed over ₹4 crore in annual ad spend across e-commerce, edtech, healthcare, real estate and app brands in India, the US and the UK. The most useful skill I picked up along the way wasn’t writing clever hooks or finding a secret audience. It was learning to look at a sad dashboard and know exactly which number to fix first.
That’s what this cheat sheet does. For every metric that matters in a Meta sales campaign, you’ll get:
- what it means, in plain language
- the formula, so you can check Meta’s maths yourself
- where to find it in Ads Manager
- what counts as good or bad, using 2026 benchmarks
- what to do when it’s bad, and what you should absolutely not do
Bookmark it. You’ll need it the next time ROAS dips on a random Tuesday and you feel the urge to “just change everything.” (Please don’t. We’ll get to why.)
Your Meta Sales Campaign Is a Shop on a Busy Street 🏪
Forget the jargon for a minute. Imagine you own a small shop on a crowded street. Every metric in Ads Manager answers one simple question about that shop.
| Funnel stage | The shop version | Meta metrics to check |
|---|---|---|
| Delivery | How many people walk past your window? | Impressions, Reach, CPM, Frequency |
| Attention | How many actually look at the window display? | Hook rate, Hold rate |
| Clicks | How many open the door and walk in? | Link CTR, CPC, Landing page view rate |
| Interest | How many pick up a product? | Add to cart rate, Checkout rate |
| Sales | How many pay at the counter? | Purchases, Conversion rate, CPA |
| Profit | Does the shop make money at the end of the month? | ROAS, Breakeven ROAS, AOV |
Now the golden rule, the one that saves beginners the most money: always fix the first leak in the funnel.
If nobody is looking at your window, redesigning the checkout counter won’t help. If people are walking in but leaving empty-handed, a prettier window display won’t help either. Find the first stage where the numbers look bad, fix that, and only then move down the list.
Before You Judge a Single Number: 4 Ground Rules
Most “my ads aren’t working” panic comes from reading perfectly normal numbers at the wrong time. Before you touch anything, run through these four checks.
1. Give it enough data. An ad that has spent ₹300 and been seen 800 times hasn’t told you anything yet. As a working rule, let an ad run for at least two to three days and collect a couple of thousand impressions before you form an opinion. Judging an ad after four hours is like judging a restaurant by the first thing the waiter says.
2. Respect the learning phase. An ad set exits learning once it generates around 50 optimization events within a rolling 7-day window, and most well-funded ad sets get there in 3 to 7 days. During that window, CPAs typically run 20 to 50% higher before they settle, so expensive early results are normal. Also note that significant edits, including budget shifts above 20 percent, new creative, optimization event changes, or major audience updates, restart the phase. Every time you fiddle, you pay the tuition fee again. Meta Ads Learning Phase: How to Exit Faster in 2026 +2
3. Know about the March 2026 click change. This one catches people off guard. For years, Meta counted a click-through conversion after any click on your ad, not just a link click. Other social actions like likes, shares and saves now sit in a renamed category called engage-through attribution, and billing is unchanged. Industry estimates put the drop in attributed clicks and click-through conversions at roughly 30% to 40%, which makes any comparison that straddles the cutoff date invalid. So if your February numbers looked better than your April numbers, you may have been comparing apples with slightly inflated apples. 🍎 Click-Through Attribution Now Requires a Link Click – Jon Loomer Digital +2
4. Compare like with like. Cold audiences (prospecting) and warm audiences (retargeting) have completely different “normal” numbers. So do India and the US. So do Diwali week and a random week in February. A metric is only good or bad relative to the right comparison.
Stage 1: Is Anyone Actually Seeing Your Ad?
CPM (Cost per 1,000 Impressions)
What it is: The rent you pay for your spot on the street. It’s how much Meta charges to show your ad 1,000 times.
Formula: CPM = (Amount Spent ÷ Impressions) × 1,000
Where to find it: The “CPM (cost per 1,000 impressions)” column in Ads Manager.
What’s normal in 2026: Rent has been going up. Across more than 40,000 brands tracked from August 2025 to July 2026, the median Meta CPM was $15.06, up 13.24% year over year. Health and Wellness had the highest median CPM at $21.80, while Baby had the lowest at $11.50. Triple Whale
India is a different planet. Indian advertisers typically pay ₹50 to ₹400 CPM on Facebook and ₹45 to ₹350 on Instagram, and Statista’s country data puts Indian Facebook CPM at roughly $2.60, around a sixteenth of the US rate. So if you’re an Indian brand reading an American blog and panicking that your CPM is “too low to be real,” relax. It’s just geography. AdiAnsh Media
If your CPM is high, do this:
- Broaden your audience or test Advantage+ audience. Tiny audiences are expensive audiences.
- Improve the creative. Meta’s auction rewards ads people actually engage with, so a better ad often gets cheaper rent.
- Test Reels placements. Reels CPMs average 25% to 40% lower than feed placements, according to 2026 India benchmark roundups. Productgrowth
- Check the calendar. Festive season, Black Friday and end-of-quarter pushes inflate everyone’s CPM.
Don’t do this:
- Don’t narrow your targeting further “to save money.” It usually does the opposite.
- Don’t judge CPM on its own. A $20 CPM with a 3% CTR can easily beat an $8 CPM with a 0.5% CTR. Cheap rent on an empty street is still a bad deal.
Frequency
What it is: How many times, on average, the same person has seen your ad. Twice is a friendly reminder. Eight times starts to feel like stalking. 👀
Formula: Frequency = Impressions ÷ Reach
Where to find it: The “Frequency” column. Reach sits right next to it.
What’s normal: There’s no universal line, but a common working rule for prospecting campaigns is to stay comfortable under about 2.5 over a 7-day window and start watching closely once you pass 3. Retargeting audiences can tolerate higher frequency because they already know you.
The real warning sign isn’t frequency alone. It’s frequency going up while CTR goes down. That combination means your audience is bored of the ad. Some operators report that ad fatigue now compresses to 2 to 3 weeks under Andromeda, Meta’s newer delivery system, so creatives burn out faster than they used to. Adlibrary
If frequency is high and performance is dropping, do this:
- Launch genuinely new creative concepts: new angle, new format, new hook.
- Expand your audience so the same people aren’t seeing everything.
Don’t do this:
- Don’t raise the budget on a tired audience. You’re paying more to annoy the same people.
- Don’t just recolour the old ad and call it new. Andromeda reads near-duplicate ads as sameness and suppresses them, so twenty tweaks of one winner doesn’t count as fresh creative. Taylorsicard
Reach and Impressions
What they are: Impressions count how many times your ad was shown. Reach counts how many different people saw it. If 100 impressions came from 20 people, each of them walked past your shop five times.
Do: Use reach to sanity-check whether your audience is large enough for your budget.
Don’t: Celebrate big impression numbers by themselves. Views don’t pay rent.
Stage 2: Did They Stop Scrolling?
This is where most Meta sales campaigns quietly die. Your ad gets shown, but the thumb keeps moving.
Hook Rate (for video ads)
What it is: The percentage of people who watched at least the first three seconds of your video. It’s your window display. Did anyone look?
Formula: Hook Rate = (3-Second Video Plays ÷ Impressions) × 100
Where to find it: Not a default column, which is why most beginners never look at it. Create it yourself: Columns → Customize Columns → Create Custom Metric, then divide “3-second video plays” by “Impressions.”
What’s normal: The median hook rate on Meta sits at 28 percent, according to 2026 creative benchmark data. A practical scale many teams use: 25% as a baseline, 30% and above as good, and 35% and above as scalable. AdbeaconAdlibrary
If your hook rate is low, do this:
- Fix the first one to three seconds only. Put a face on screen, use movement, show bold on-screen text, or call out the viewer’s problem immediately.
- Test three to five different openings on the same video body. It’s the cheapest creative test you can run.
- Design for sound-off viewing, because a large share of people scroll on mute.
Don’t do this:
- Don’t re-edit the entire video. Only the opening is broken, so only the opening needs surgery.
Hold Rate
What it is: Of the people who stopped, how many kept watching? Hook rate tells you the window display worked. Hold rate tells you whether the story inside was worth staying for.
Formula: Hold Rate = (ThruPlays ÷ 3-Second Video Plays) × 100
(A ThruPlay is counted when someone watches 15 seconds of your video, or the whole thing if it’s shorter.)
What’s normal: A good target is to pair a healthy hook rate with a 40% to 50% hold rate. Adlibrary
If your hold rate is low, do this:
- Tighten the pacing. Cut the slow middle section everyone skips.
- Deliver on what the hook promised. If the opening says “the mistake costing you money,” show the mistake quickly.
- Add captions and keep the visuals changing every few seconds.
Don’t do this:
- Don’t blame the hook. The hook did its job. The story didn’t.
Running static image ads? Hook and hold rate don’t apply. Use link CTR (below) as your attention signal instead.
Stage 3: Did They Click?
CTR (Link Click-Through Rate)
What it is: The percentage of people who saw your ad and clicked through to your website. In shop terms, how many people opened the door.
Formula: CTR (link) = (Link Clicks ÷ Impressions) × 100
Where to find it: The column called “CTR (link click-through rate).” Not “CTR (all).” This trips up almost every beginner. “CTR (all)” includes likes, profile taps, comment clicks and “see more” taps, which makes your ad look more popular than it is. For a sales campaign, only the link click matters.
What’s normal: Benchmark sources measure CTR in different ways, so treat these as ranges, not targets. Triple Whale’s 2025 to 2026 dataset shows a median CTR of 2.39%, up almost 16% year over year. WordStream’s all-industry CTR average for traffic campaigns is 1.71%. A simpler rule of thumb: anything above 1.5% counts as a good CTR for most verticals. Your link CTR will usually run lower than some of these published medians, so compare against your own past performance too. Facebook Ad Benchmarks by Industry (Updated 2026 Data) | Triple Whale +2
If your CTR is low, do this:
- Work on the creative first. New visual, new angle, clearer offer. This is the classic “low CTR means work on creatives” situation.
- Make the reason to click obvious: price, discount, a clear benefit or a deadline.
- Check audience fit. A brilliant ad shown to the wrong people still gets ignored.
Don’t do this:
- Don’t touch the landing page yet. Hardly anyone has seen it.
- Don’t chase CTR with clickbait. It lifts clicks and then wrecks your conversion rate.
CPC (Cost per Link Click)
What it is: What you pay, on average, each time someone clicks through to your site.
Formula: CPC = Amount Spent ÷ Link Clicks
Here’s the useful bit: CPC is simply CPM and CTR working together. CPC = CPM ÷ (CTR × 10), with CTR entered as a percentage. With a ₹150 CPM and a 1.5% CTR, your CPC works out to ₹10. So a high CPC always means expensive rent, weak clicks, or both. Check those two metrics and you’ll know which.
What’s normal: The average CPC for traffic campaigns is $0.70, ranging from $0.34 for Shopping and Gifts up to $1.22 for Finance and Insurance. In India, clicks land between ₹5 and ₹30 in most categories. HawkyAdiAnsh Media
Do: Diagnose CPC through CPM and CTR rather than treating it as its own problem.
Don’t: Optimise a sales campaign for cheap clicks. A thousand cheap clicks from people who never buy is the most expensive traffic there is.
Landing Page View Rate
What it is: People clicked the door, but did the door actually open? This compares clicks against people whose landing page actually loaded.
Formula: LPV Rate = (Landing Page Views ÷ Link Clicks) × 100
What’s normal: A widely used working rule is that 70% to 80% or higher is healthy, while anything under about 60% deserves investigation. The gap is people who clicked and then left before your page loaded.
If it’s low, do this:
- Test your page speed on a mobile phone over a normal mobile connection, not your office Wi-Fi.
- Check that your Meta Pixel and Conversions API (CAPI) are firing properly. Broken tracking looks exactly like broken performance.
- Check your placements. Audience Network is the cheapest by volume but consistently generates the lowest downstream intent signals. UpGrowth
Don’t do this:
- Don’t change the ad. The ad did its job. Your website dropped the ball.
Stage 4: Did They Buy?
Add to Cart Rate
What it is: Of the people who landed on your page, how many picked up a product?
Formula: ATC Rate = (Adds to Cart ÷ Landing Page Views) × 100
What’s normal: This varies a lot by product and price point. Many e-commerce media buyers treat roughly 5% to 10% as a reasonable range from cold traffic, with anything below that worth a closer look.
If it’s low, do this:
- Make the ad and the landing page match. If the ad shows the blue running shoes, land people on the blue running shoes, not your homepage.
- Review price, product photos, reviews, size guides and trust signals.
Don’t do this:
- Don’t blame Meta. The traffic arrived. The shelf just didn’t convince anyone.
Checkout Rate and Purchase Rate
What they are: The last two doors before the cash counter.
Formulas:
Checkout Rate = (Checkouts Initiated ÷ Adds to Cart) × 100Purchase Rate = (Purchases ÷ Checkouts Initiated) × 100
If people drop at checkout, look for: surprise shipping costs, forced account creation, long forms, or (a big one in India 🇮🇳) no cash-on-delivery option.
If people drop at payment, look for: failed payments, missing UPI or wallet options, or a checkout page that suddenly looks less trustworthy than the rest of your site.
Do: Set up retargeting for cart abandoners. These are the warmest people you’ll ever pay to reach.
Don’t: Pour more ad budget into a leaking checkout. You’re just filling a bucket with a hole in it.
Conversion Rate (CVR)
What it is: The percentage of visitors who end up buying.
Formula: CVR = (Purchases ÷ Link Clicks) × 100. Some teams use landing page views instead of link clicks, which gives a slightly cleaner number. Pick one and stay consistent.
What’s normal: The median Meta CVR across the latest dataset was 1.53%. Food and Beverage led at 1.89%, while Medical Devices and Equipment sat at the bottom with 1.09%. Triple Whale
A useful warning sign from the same data: Electronics saw CTR rise over 21% while CVR fell almost 16%, meaning ads earned more clicks but those clicks converted less, which points to post-click friction or a weaker offer. Rising clicks aren’t automatically good news. Triple Whale
Do: Use the stage-by-stage drop-offs above to find exactly where people leave.
Don’t: Judge conversion rate on 30 clicks. That’s gossip, not data.
CPA (Cost per Purchase)
What it is: What you pay in ads to get one sale.
Formula: CPA = Amount Spent ÷ Purchases
What’s normal: The median CPA across all industries was $38.99 in the latest benchmark period. More important than any benchmark is your maximum affordable CPA: the most you can pay for one sale and still make a profit. Triple Whale
Here’s a quick example. You sell a ₹2,000 product with a ₹800 profit after product cost, shipping and payment fees. Your absolute ceiling is ₹800 per sale. Pay more than that and every order loses money, no matter how exciting the dashboard looks.
If CPA is too high, do this:
- Trace it back up the funnel. CPA is the result, not the cause. The cause lives in one of the metrics above.
Don’t do this:
- Don’t slash the budget by 50% overnight. Move budgets in steps of around 20% so you don’t keep resetting the learning phase.
Stage 5: Did You Actually Make Money? 💰
ROAS (Return on Ad Spend)
What it is: How much revenue you got back for every rupee or dollar spent on ads.
Formula: ROAS = Purchase Conversion Value ÷ Amount Spent
Spend ₹10,000, bring in ₹35,000 in sales, and your ROAS is 3.5x.
Where to find it: The “Purchase ROAS (return on ad spend)” column.
What’s normal: The median Meta ROAS was 1.88. Sports and Outdoors topped the list at 2.35, while Media and Publishing had the lowest at 1.13. Triple Whale
But “normal” is almost useless here, because a ROAS that makes one brand rich can bankrupt another. That’s why you need the next metric.
Breakeven ROAS (The Most Underrated Number in This Post)
What it is: The minimum ROAS you need just to avoid losing money.
Formula: Breakeven ROAS = 1 ÷ Profit Margin
Your profit margin here means what’s left after product cost, shipping, payment gateway fees and an allowance for returns, written as a decimal.
| Your profit margin | Your breakeven ROAS |
|---|---|
| 20% | 5.0x |
| 25% | 4.0x |
| 30% | 3.33x |
| 40% | 2.5x |
| 50% | 2.0x |
| 60% | 1.67x |
Read that table again, slowly. If your margin is 25%, a 3x ROAS, the kind people screenshot and post on LinkedIn, is actually losing you money. Meanwhile a brand with 60% margins can be quietly profitable at 2x.
Do: Calculate your breakeven ROAS before you launch anything, and judge every campaign against it.
Don’t: Brag about ROAS without knowing your margin. That’s like bragging about revenue while your rent is overdue.
AOV (Average Order Value)
What it is: How much the average customer spends per order.
Formula: AOV = Total Revenue ÷ Number of Orders
What’s normal: The median AOV across Meta-driven orders was $73.36, with Travel Accessories and Luggage highest at $121.18. Triple Whale
Why beginners should care: A higher AOV makes every other metric easier. If each customer spends more, you can afford a higher CPA and still hit breakeven.
Do: Raise AOV with bundles, a free-shipping threshold set slightly above your current AOV, and relevant upsells at checkout.
Bonus: Meta’s Own Report Cards
Ads Manager also gives each ad three diagnostic rankings: Quality Ranking (how your ad’s perceived quality compares with competitors targeting the same audience), Engagement Rate Ranking (expected engagement compared with competitors), and Conversion Rate Ranking (expected conversion rate compared with competitors). “Below average” on quality or engagement usually points back to the creative. “Below average” on conversion rate usually points to the offer or the landing page.
Meta Sales Campaign Benchmarks by Industry (2026)
Now the part everyone scrolls straight to. These figures come from Triple Whale’s analysis of more than 40,000 brands running Meta ads between August 1, 2025 and July 31, 2026. All numbers are medians in USD. Triple Whale
| Industry | CTR | CVR | CPM | CPA | ROAS |
|---|---|---|---|---|---|
| Apparel and Accessories | 2.44% | 1.47% | $13.25 | $36.98 | 2.24 |
| Beauty | 2.46% | 1.79% | $18.80 | $39.31 | 1.54 |
| Health and Wellness | 3.02% | 1.50% | $21.80 | $40.53 | 1.44 |
| Home and Garden | 2.38% | 1.24% | $14.67 | $47.93 | 2.25 |
| Food and Beverage | 1.98% | 1.89% | $15.32 | $38.57 | 1.61 |
| Electronics | 2.41% | 1.13% | $15.09 | $51.86 | 1.94 |
| E-learning and Online Courses | 2.74% | 1.31% | $14.05 | $26.80 | 1.19 |
| All industries | 2.39% | 1.53% | $15.06 | $38.99 | 1.88 |
Three things to keep in mind when you read this table:
These are mostly US-weighted e-commerce numbers. If you advertise in India, your CPM and CPC will look dramatically different. One 2026 e-commerce dataset puts CPM at $1.36 in India against $16.08 in the United States. Lower costs don’t automatically mean better results, so judge Indian campaigns on CPA and ROAS against your own margins. Lebesgue: AI CMO
Medians aren’t goals. Half of all advertisers perform below the median. Beating it is good. Matching it isn’t a disaster.
Your own history beats any benchmark. After three months of running ads, your account’s past averages become the most useful comparison you have.
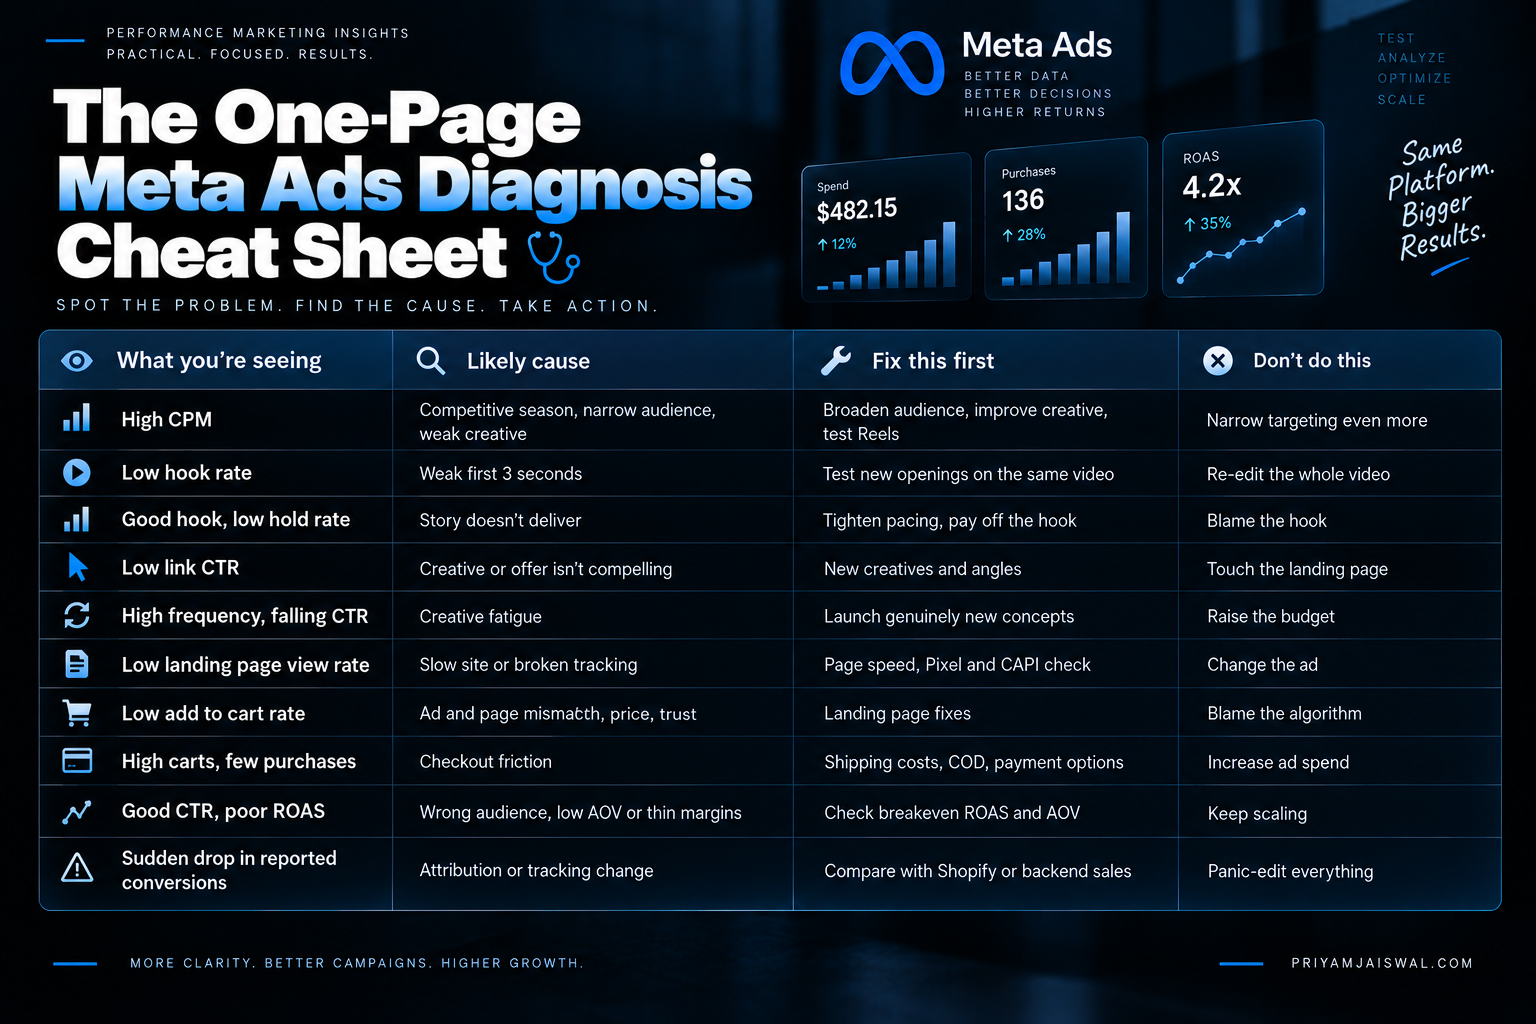
The One-Page Meta Ads Diagnosis Cheat Sheet 🩺
Screenshot this. Print it. Stick it next to your monitor.
| What you’re seeing | Likely cause | Fix this first | Don’t do this |
|---|---|---|---|
| High CPM | Competitive season, narrow audience, weak creative | Broaden audience, improve creative, test Reels | Narrow targeting even more |
| Low hook rate | Weak first 3 seconds | Test new openings on the same video | Re-edit the whole video |
| Good hook, low hold rate | Story doesn’t deliver | Tighten pacing, pay off the hook | Blame the hook |
| Low link CTR | Creative or offer isn’t compelling | New creatives and angles | Touch the landing page |
| High frequency, falling CTR | Creative fatigue | Launch genuinely new concepts | Raise the budget |
| Low landing page view rate | Slow site or broken tracking | Page speed, Pixel and CAPI check | Change the ad |
| Low add to cart rate | Ad and page mismatch, price, trust | Landing page fixes | Blame the algorithm |
| High carts, few purchases | Checkout friction | Shipping costs, COD, payment options | Increase ad spend |
| Good CTR, poor ROAS | Wrong audience, low AOV or thin margins | Check breakeven ROAS and AOV | Keep scaling |
| Sudden drop in reported conversions | Attribution or tracking change | Compare with Shopify or backend sales | Panic-edit everything |
7 Beginner Mistakes That Burn Money on Meta Sales Campaigns 🔥
1. Killing ads after one day. Early data is noisy, and the learning phase makes early costs higher by design. Give ads time before you decide.
2. Reading CTR (all) instead of CTR (link). It flatters your ads and hides real problems.
3. Editing during the learning phase. Every significant change resets learning and makes you pay the tuition fee again.
4. Judging ROAS without knowing your margin. A 3x ROAS can be fantastic or disastrous. Only your breakeven ROAS knows which.
5. Fixing the wrong stage. Redesigning the landing page when the ad isn’t getting clicks, or remaking ads when the checkout is broken. Always fix the first leak.
6. Spreading tiny budgets across too many ad sets. Ten ad sets at ₹300 a day each will struggle to exit learning. Two or three well-funded ones usually perform better.
7. Trusting Ads Manager blindly. Meta’s numbers are Meta’s opinion of what happened. Always compare them with your actual sales in Shopify, WooCommerce or your CRM, especially after an attribution change.
How to Set Up a “Sales Diagnosis” Column Preset (5 Minutes)
Stop rebuilding your columns every time you log in. Set this up once and save it.
- In Ads Manager, click Columns, then Customize Columns.
- Add these, roughly in funnel order: Amount spent, Impressions, Reach, Frequency, CPM, 3-second video plays, ThruPlays, Link clicks, CTR (link click-through rate), CPC (cost per link click), Landing page views, Adds to cart, Checkouts initiated, Purchases, Cost per purchase, Purchase conversion value and Purchase ROAS.
- Click Create Custom Metric and build Hook Rate (3-second video plays ÷ Impressions) and Hold Rate (ThruPlays ÷ 3-second video plays).
- Drag the columns into funnel order, so you literally read the shop story from left to right.
- Tick Save as preset, name it “Sales Diagnosis,” and you’re done.
Now every time you open Ads Manager, the whole funnel is in front of you, and the first bad number jumps out.
Frequently Asked Questions
What are the most important metrics for a Meta sales campaign?
The core Meta sales campaign metrics are CPM, frequency, hook rate, hold rate, link CTR, CPC, landing page view rate, add to cart rate, conversion rate, cost per purchase, ROAS and AOV. If you only have time for three, watch link CTR, cost per purchase and ROAS compared against your breakeven ROAS.
What is a good CTR for Meta ads in 2026?
A CTR above 1.5% is generally considered good for most verticals, although published medians run higher in some datasets because tools measure clicks differently. Always use the “CTR (link click-through rate)” column for sales campaigns, and compare against your own account history. Rule1
What is a good ROAS for a Meta sales campaign?
A good ROAS is any ROAS above your breakeven ROAS, which you calculate as 1 divided by your profit margin. For context, the median Meta ROAS across more than 40,000 brands was 1.88 in the latest benchmark period. Triple Whale
Why is my Meta ads CPM so high?
High CPM usually comes from auction competition (festive seasons and competitive industries), narrow targeting, or low-quality creative. Broaden your audience, improve your creative and test Reels placements before you conclude anything is broken.
How long should I run a Meta ad before judging it?
Give an ad at least two to three days and a couple of thousand impressions before judging it. For the ad set as a whole, allow it to exit the learning phase, which happens after roughly 50 optimization events within a 7-day window. Coinis
What is the difference between CTR (all) and CTR (link)?
CTR (all) counts every click on your ad, including likes, comments, profile taps and “see more” expansions. CTR (link) only counts clicks that send people to your website. For sales campaigns, CTR (link) is the one that matters.
Why did my Meta conversions suddenly drop in 2026?
If spend and delivery stayed steady but reported conversions fell, the cause may be Meta’s attribution update. Since March 2026, only clicks on links to websites, apps, lead forms or shops count as click-attributed conversions, whereas likes, shares and other interactions used to be included too. Compare Ads Manager against your backend sales before changing anything. Growthhackers
The Bottom Line
Reading Meta ads isn’t about memorising 200 metrics. It’s about asking the right question in the right order. Did they see it? Did they stop? Did they click? Did they buy? Did you make money?
Find the first “no” in that chain and fix it. That single habit accounts for most of what good media buyers actually do all day. The rest is coffee and waiting for the learning phase to end. ☕
Want someone to run this diagnosis on your account? At ScaleMint Growth, we audit Meta sales campaigns for e-commerce, edtech, healthcare, real estate and app brands across India, the US and the UK. Book a free account audit →